Thermodynamics of intercalation materials
On this page we’ll take a look at the factors which determine electrode potential in intercalation electrode materials. We’ll look at the chemical potentials of the ion and the electron, and the lattice gas model: a basic model which helps us understand the origin of the different potential/voltage profile “shapes” we see in practice.
A (re-)introduction to intercalation materials
In our introduction to the thermodynamics of batteries we looked at the concept of the Nernst equation to understand what determines the electrode potential and ultimately the cell voltage. Here, we will look in more detail at the more complex chemistry which is the foundation of most Li-ion batteries, introduce a similarly fundamental model for understanding their electrode potential, and see how this helps us understand certain behaviours of these materials which we see in practice.
First, let’s remind ourselves of the basic construction of a Li-ion battery and the materials used. A schematic of a basic Li-ion cell is shown below. The arrows indicate the movement of ions and electrons when the cell is discharging.

A Li-ion battery is constructed from two electrodes, each made of a material capable of reversibly hosting and releasing Li+ ions; between them is a separator, which holds a (typically) liquid electrolyte which transfers those ions between the electrodes. The battery’s ability to store electricity relies on a large difference in the energy associated with hosting the Li+ ions in each electrode. That is, the removal of Li+ ions from the negative electrode and their insertion into the positive electrode should be accompanied by a large release of energy.
Chemical potential of lithium
Here, we will introduce the concept of chemical potential. The chemical potential is defined as the thermodynamic ability of a particle (e.g. an atom or ion) to perform physical work. It can be thought of as the energy required to introduce one more particle to the system, or alternatively the energy obtained by removing one particle from the system.
In an intercalation material, where the Li+ ion is incorporated into the structure of a host material, the electrode potential $E$ is determined by the chemical potential of the lithium atoms in the structure $\mu_\text{Li}$, which is in turn dependent on the chemical potential of the lithium ions and the chemical potential of the electrons in the structure. Mathematically, this is written as follows:
$$E = \frac{\mu_\text{Li}}{F} = \frac{\mu_{\text{Li}^+} + \mu_{\text{e}^-}}{F} \tag{1}$$The units of chemical potential are typically kJ mol-1 and the units of Faraday’s constant are C mol-1. Dividing a chemical potential by Faraday’s constant, and accounting for a conversion of kJ to J, gives units for the potential of J C-1. One volt, 1 V = 1 J C-1.
Chemical potential of the electron
The chemical potential of the electron is equivalent to the Fermi level, and it is always negative. Broadly speaking, the chemical potential of the electron is largely determined by the redox-active constituents in the host material: the Fermi level is defined as the energy level at which we have a 50% probability of finding an electron. In transition metal oxides, for example, this is largely determined by the redox couple of the transition metal itself, similar to what we saw in the discussion of the Daniell cell. The atoms neighbouring the transition metal in the structure also play a pivotal role.

Figure reproduced based on Goodenough and Kim, 2010
The schematic above illustrates the position of the Fermi level for some different materials. This illustrates the larger difference of the energy level of the Co3+/Co4+ couple vs Li/Li+ compared to Ti3+/Ti4+. It also illustrates the strong “inductive effect” of the PO43- anion in LiCoPO4 despite the lower oxidation states of the Co – but we will delve into this in more detail in a later page.
Chemical potential of the ion
A simple model for the chemical potential of the ion is the lattice gas model. This model assumes that when ions are introduced into the structure they are distributed randomly with no short-range order. We can call the resulting material a solid solution - the ions ‘dissolve’ completely into the host structure without significantly altering its structure.

In the lattice gas, the chemical potential of the ion changes with the fraction of occupied sites, $x$, according to the following expression:
$$ \mu_{\text{Li}^+} = \mu_{\text{Li}^+}^\plimsoll + RT \ln \left[ \frac{x}{1-x} \right] + kx$$This right hand side of this equation consists of three parts. $\mu_{\text{Li}^+}^\plimsoll$ is the standard chemical potential for the Li+ ion in the structure. This can be thought of as the “site energy”, which is primarily determined by electrostatic interactions with the neighbouring ions in the structure. The term $RT \ln \left[ \frac{x}{1-x} \right]$ describes the contribution of the entropy of the ions in the solid solution, which is dependent on the fraction of the available sites in the structure which are occupied. Finally, we have a parameter, $k$, for modelling non-ideal interactions between the ions in the structure. $k$ is negative for attractive interactions.
We can plot this expression as a function of $x$ and animate to show the effect of changing the non-ideal parameter $k$. In the plot below, we have a y-axis of $-\frac{\left(\mu_{\text{Li}^+}-\mu^\plimsoll_{\text{Li}^+}\right)}{F}$, or the change in the chemical potential of the ion relative to the site energy, divided by Faraday’s constant. The change in this value with ion concentration in the solid reflects the change we expect in the electrode potential.
As you can see in the plot, the change in the y-axis indicates that we expect a continuously decreasing electrode potential with increasing ion content in the electrode, with the steepest change closest to the extremes of fully empty or fully occupied sites.
The decrease in $k$ (increase in ion-ion attraction) increases the slope of the curve. With a large enough $k$, the slope increases such that the value of $-\mu_{\text{Li}^+}$ begins increasing with increasing ion content, with a distinct minimum and maximum near $x = 0$ and $x = 1$. This is significant, because it predicts that with a strong enough ion-ion interaction, the material should phase-separate into two materials with high and low guest ion concentrations respectively, where the formation of distinct phases is more favourable than the solid solution. In this case, we have a “two phase” intercalation reaction.
Does this model hold in practice?
In commercially available Li-ion battery materials, no, not really – the materials we commonly use in batteries today behave significantly differently than the ideal behaviour, but the model is still useful for understanding some of the features of intercalation materials.
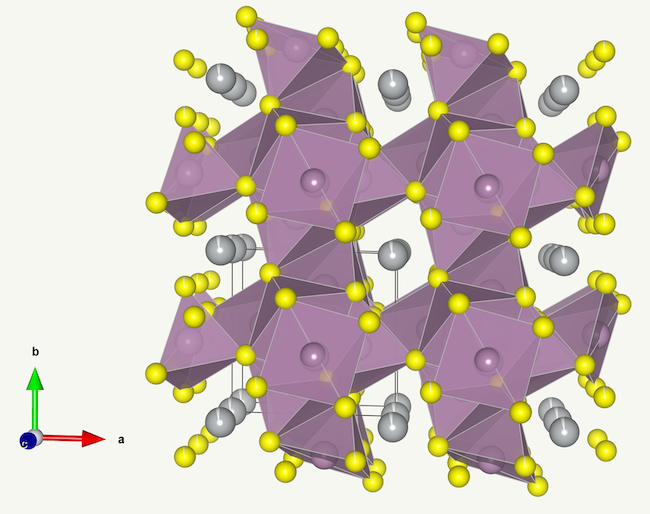
That said, there is at least one class of materials which does fit the model behaviour relatively well. Chevrel phases, which are a broad class of compounds with the general formula MxMo6X8, where X is either S or Se. These compounds form slightly distorted cubic structures with very large vacancies where the guest ion M can be incorporated and be able to diffuse in all three crystallographic directions, and freely due to the ‘softness’ of the anion. The vacancies in Chevrel phases are so large that they can readily incorporate relatively large ions such as Pb2+ or Ag+. The structure of one such compound, AgMo6S8, is shown below (data for the model can be found here).
A lithium Chevrel phase, LixMo6Se8 was studied in detail in the mid-1980s([1],[2]) and demonstrated to fit the lattice gas model very closely for the composition with a Li content of up to 1 Li per Mo6Se8 unit. The fit of the model also correctly predicted the phase separation of the material into two phases at lower temperature.
Supporting literature
[1] S.T. Coleman, W.R. McKinnon, J.R. Dahn, “Lithium intercalation in LixMo6Se8: A model mean-field lattice gas”, Phys. Rev. B 29, 4147 (1984)
[2] J.R. Dahn, W.R. McKinnon, J.J. Murray, R.R. Haering, R.S. McMillan, A.H. Rivers-Bowerman, “Entropy of the intercalation compound LixMo6Se8 from calorimetry of electrochemical cells”, Phys. Rev. B 32, 3316 (1985)