An Exercise in Analysing EIS data
If you’ve studied all of the previous pages in this series, why not put your new-found skills to the test with a little exercise?
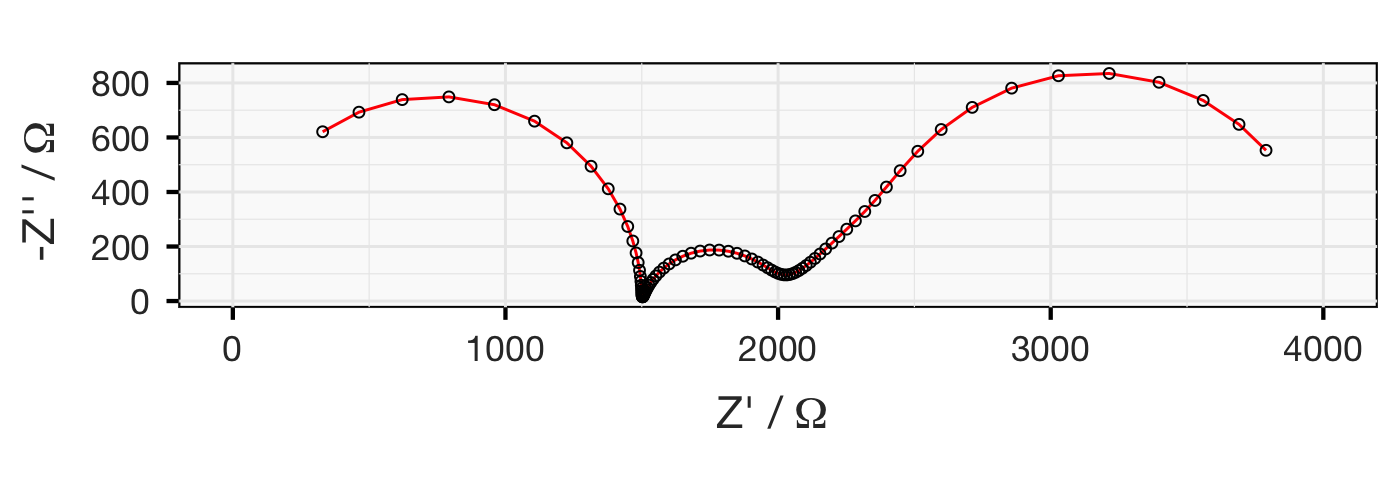
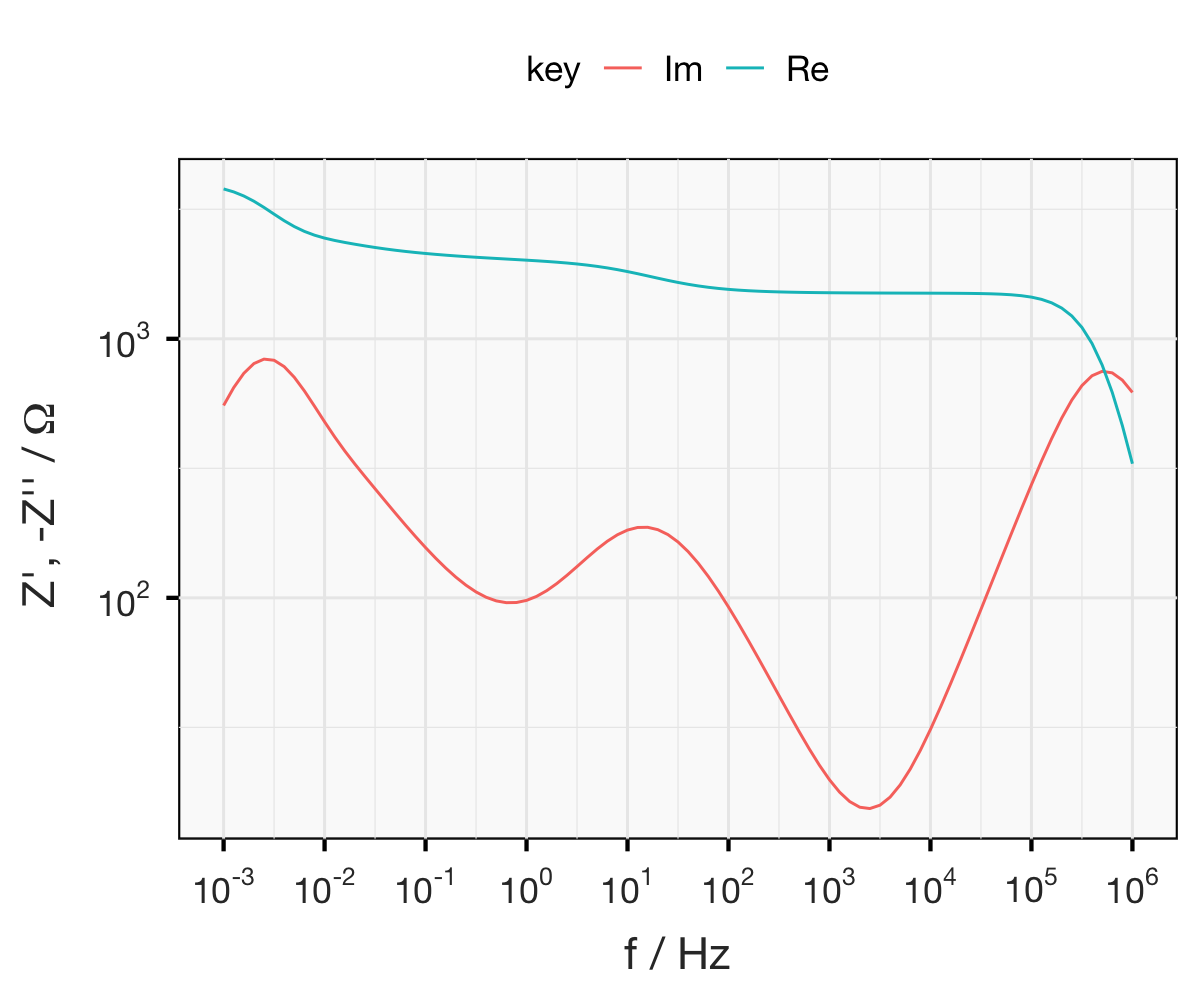
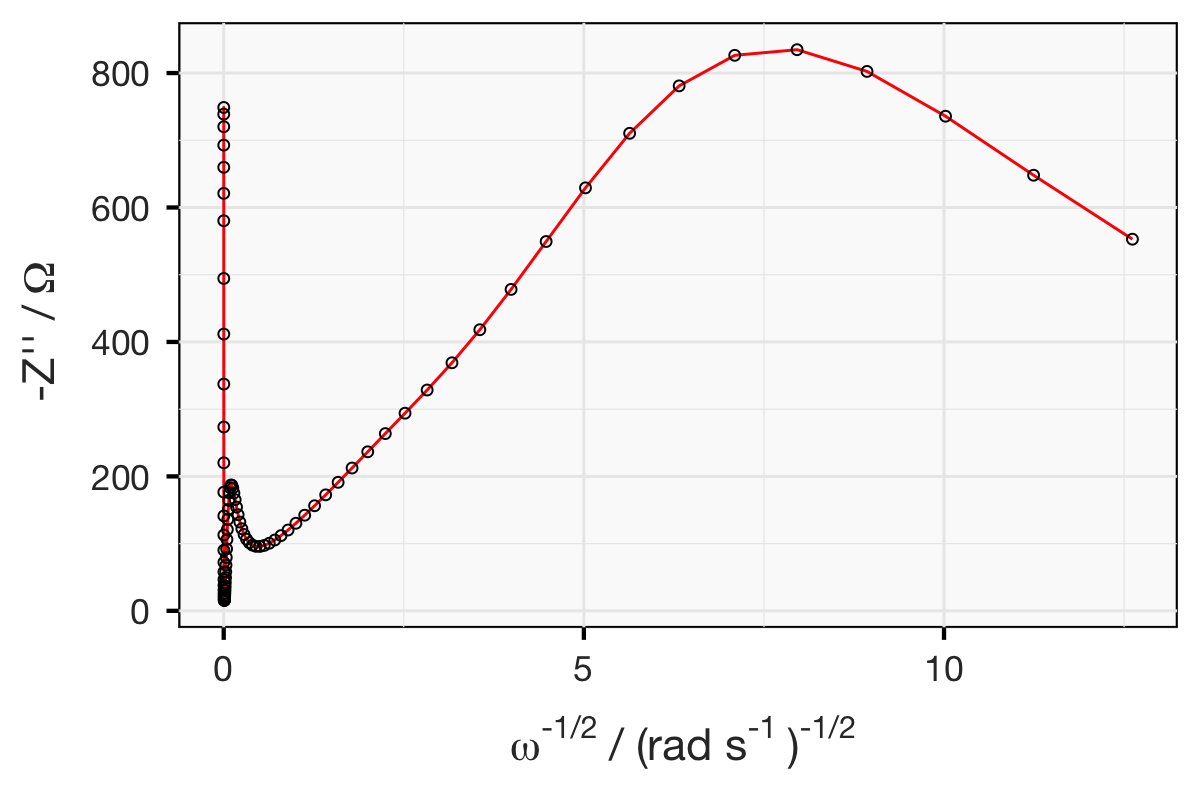
Below are three plots of simulated impedance data. The data is representative of a symmetrical electrochemical cell, comprising a thin lithium-conducting polymer electrolyte with relatively poor ionic conductivity, sandwiched between two lithium metal electrodes. (Hint: this sort of system is discussed here and here.)
Exercise: from the plots below, can you propose an equivalent circuit? Once you have come up with a circuit model, can you calculate all the relevant parameters… by hand?
This is a tricky exercise. See how far you get - and if you’re done or can go no further, why not try your hand at fitting the “raw” data? You can download the data here.
A little about this exercise
This exercise is a variant of one I used in teaching on a number of occasions. There are several aims here, which I believe test some of the most important skills for building real competence in the technique:
- To understand how to propose a reasonable equivalent circuit, based on what one knows about the system under study and what features can be seen in the data
- To understand how impedance data can be plotted and what information it provides
- To be able to calculate parameters by hand, at least as a way to give initial guesses to the fitting software, so it can refine the fit for more complex models
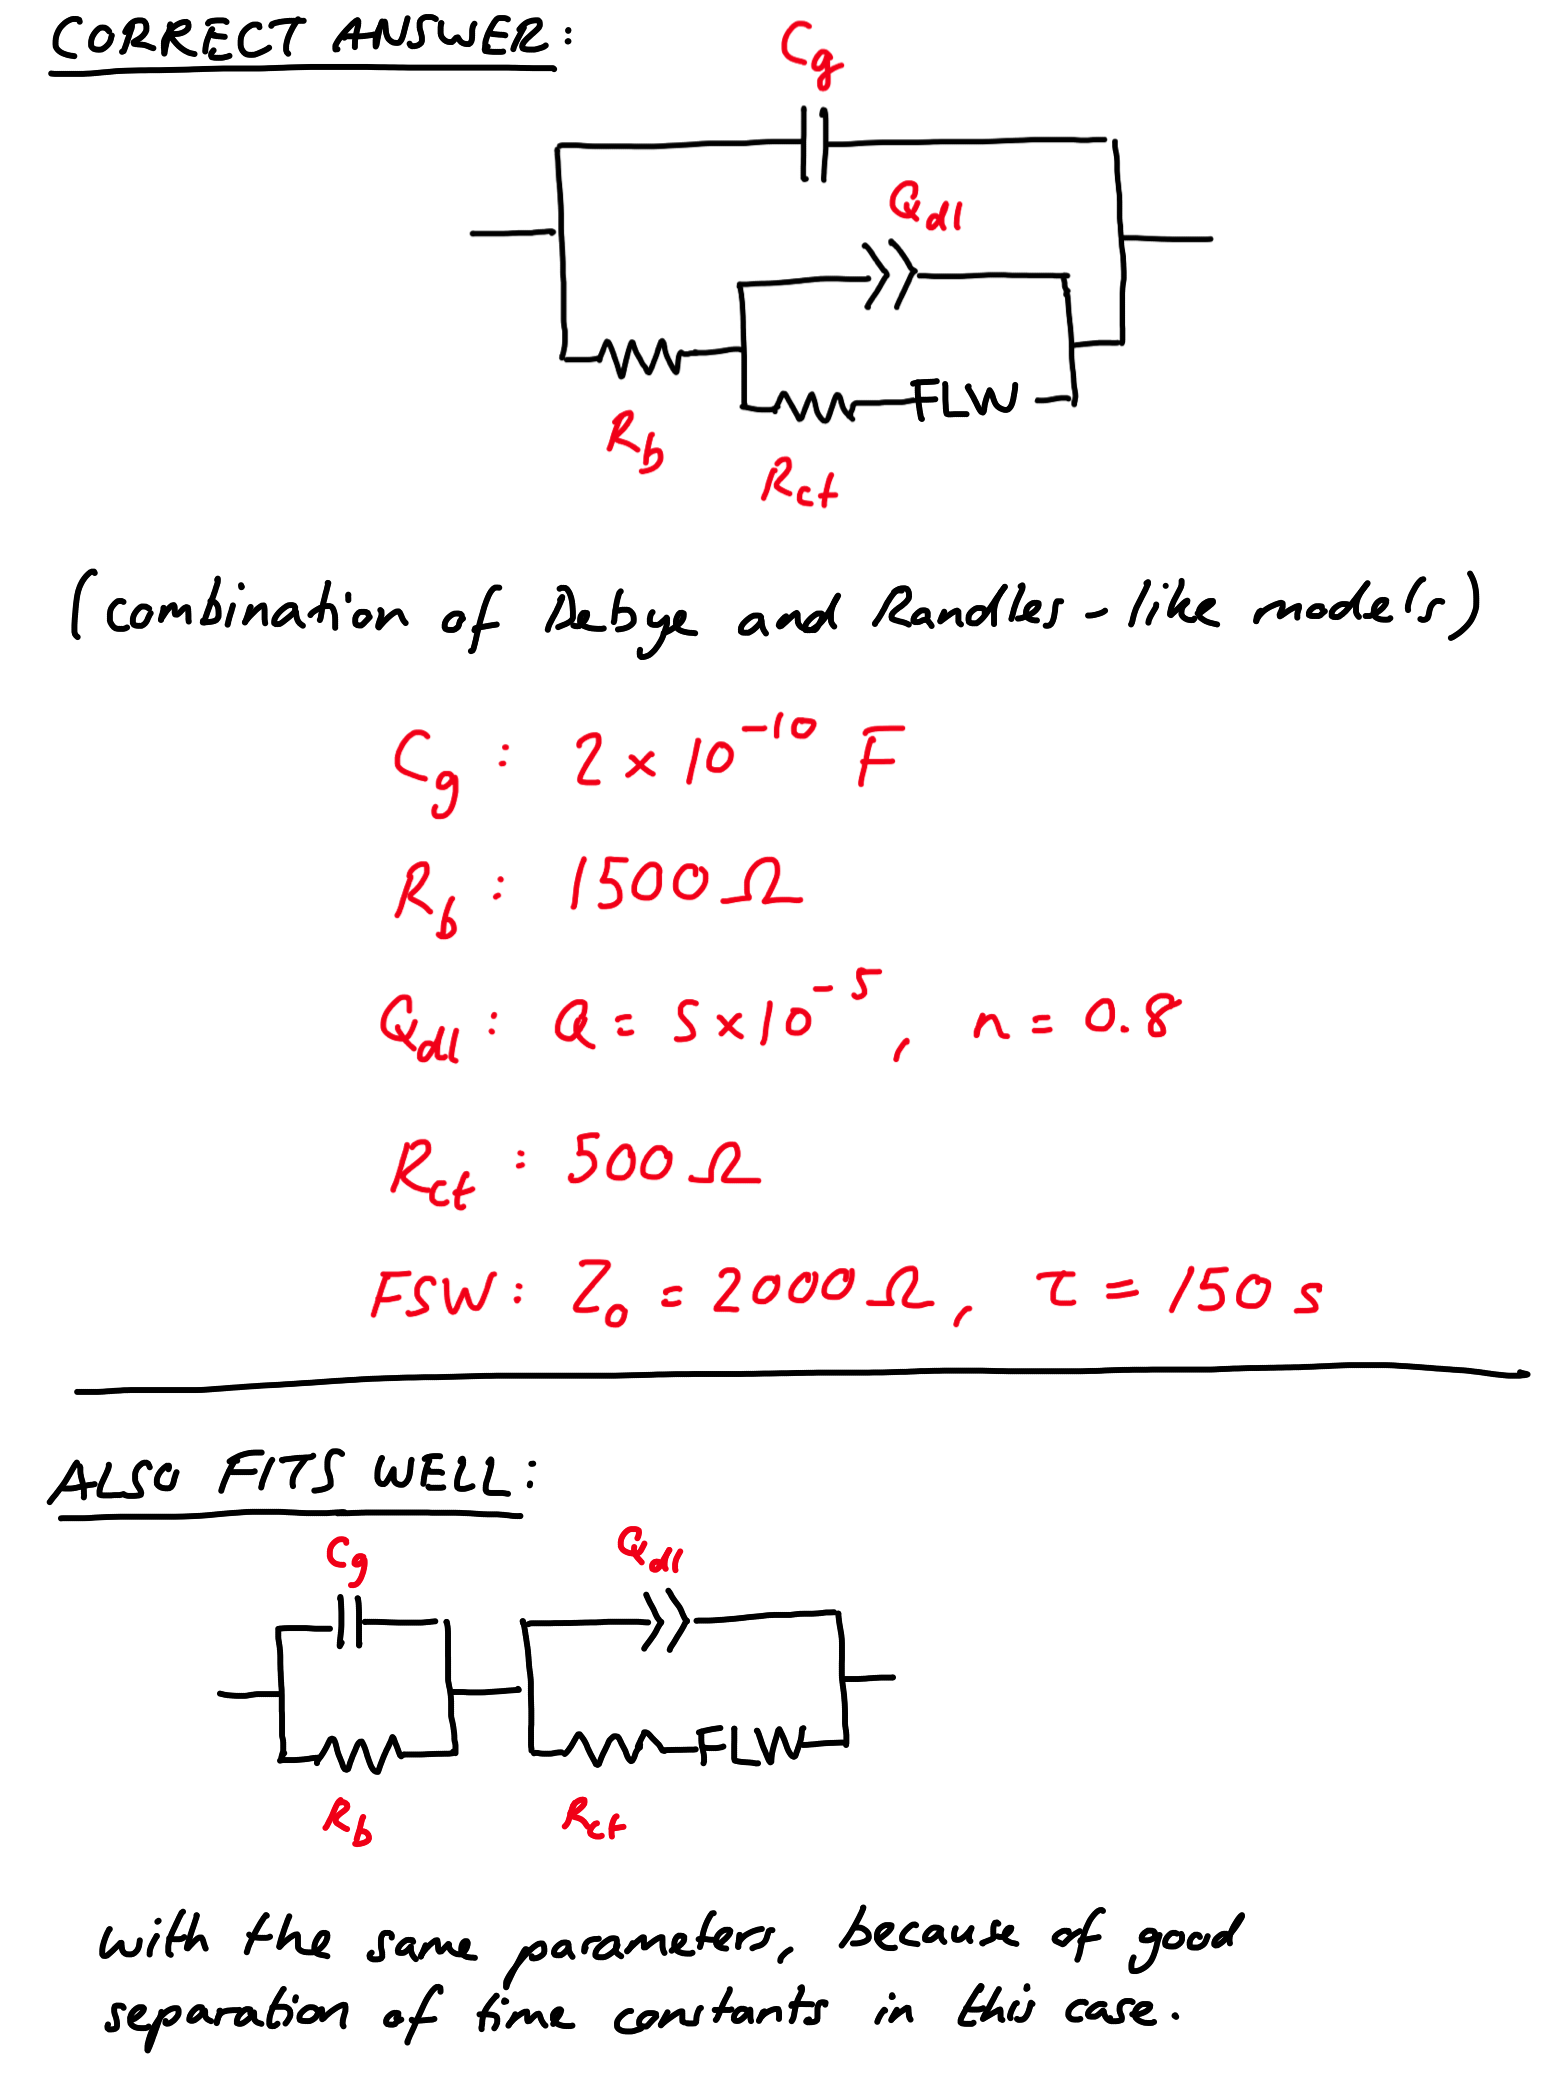
Want to check your answers? You can check how you did against the real circuit and parameters by following this link. Don’t cheat!